Ensemble Parallel MDAnalysis
![]()


Warning
This is still under constrution.
ENPMDA
Parallel analysis for ensemble simulations
powered by MDAnalysis.
ENPMDA stores metadata in pandas.DataFrame
and distributes computation jobs in dask.DataFrame
so that the parallel analysis can be performed
not only for one single trajectory
but also across simulations and analyses.
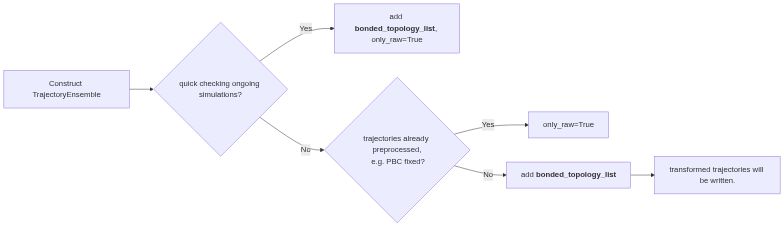
It can be used as an initial inspection of the raw trajectories as well as a framework for extracting features from final production simulations for further e.g. machine learning and markov state modeling. It automatically fixes the PBC issue and align and center the protein inside the simulation box. It also works for multimeric proteins!
The framework is intended to be adaptable by being able to simply wrapping MDAnalysis analysis functions without worrying about the parallel machinery behind.
Example Code Snippet
from ENPMDA import MDDataFrame
from ENPMDA.preprocessing import TrajectoryEnsemble
from ENPMDA.analysis import get_backbonetorsion, rmsd_to_init

# construct trajectory ensemble
traj_ensemble = TrajectoryEnsemble(
                                ensemble_name='ensemble',
                                topology_list=ensemble_top_list,
                                trajectory_list=ensemble_traj_list
                                )
traj_ensemble.load_ensemble()

# initilize dataframe and add trajectory ensemble
md_dataframe = MDDataFrame(dataframe_name='dataframe')
md_dataframe.add_traj_ensemble(traj_ensemble, npartitions=16)

# add analyses
md_dataframe.add_analysis(get_backbonetorsion)
md_dataframe.add_analysis(rmsd_to_init)


# save dataframe
md_dataframe.save('results')

# retrieve feature
feature_dataframe = md_dataframe.get_feature([
                    'torsion',
                    'rmsd_to_init'
                    ])

# plot analysis results
import seaborn as sns
sns.barplot(data=feature_dataframe,
            x='system',
            y='rmsd_to_init')
sns.lineplot(data=feature_dataframe,
             x='traj_time',
             y='0_phi_cos',
             hue='system')
Workflow Illustration
Free software: GNU General Public License v3
Documentation: https://ENPMDA.readthedocs.io.